First car
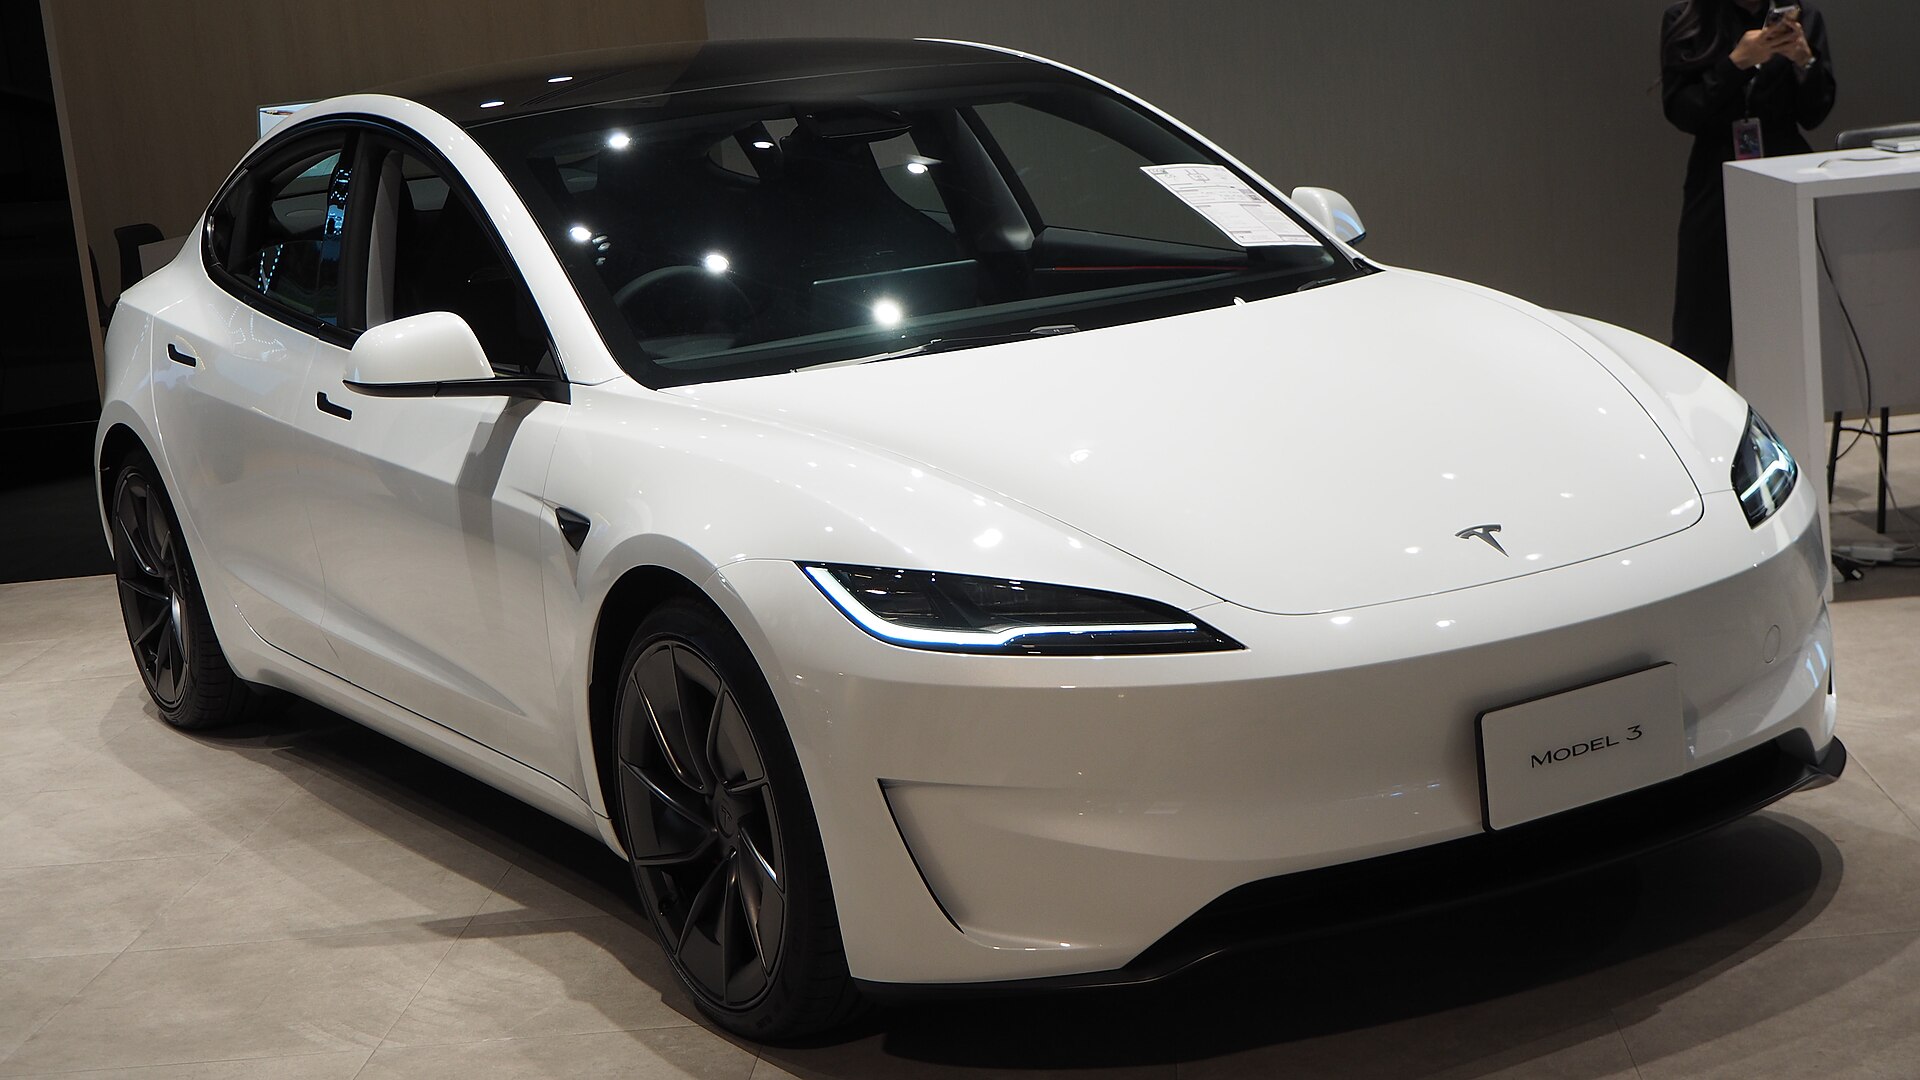
Tesla Model 3
WLTP, version dependent
Choose two cars. Charjin keeps test cycles and market caveats visible so similar-looking numbers are not mistaken for identical evidence.
WLTP, version dependent
WLTP, version dependent
Published maxima, visualised without converting between test cycles or inventing missing specifications.
Up to 750 km · 460–570 km
Not officially disclosed · 61.4 or 82.5 kWh
Up to 250 kW · Up to 150 kW
Lower consumption is better, but only like-for-like electric figures are plotted.
Orientation only. A high peak does not describe the complete charging curve.
The original wording remains visible beside the charts, including every version, market, and test-cycle qualification.
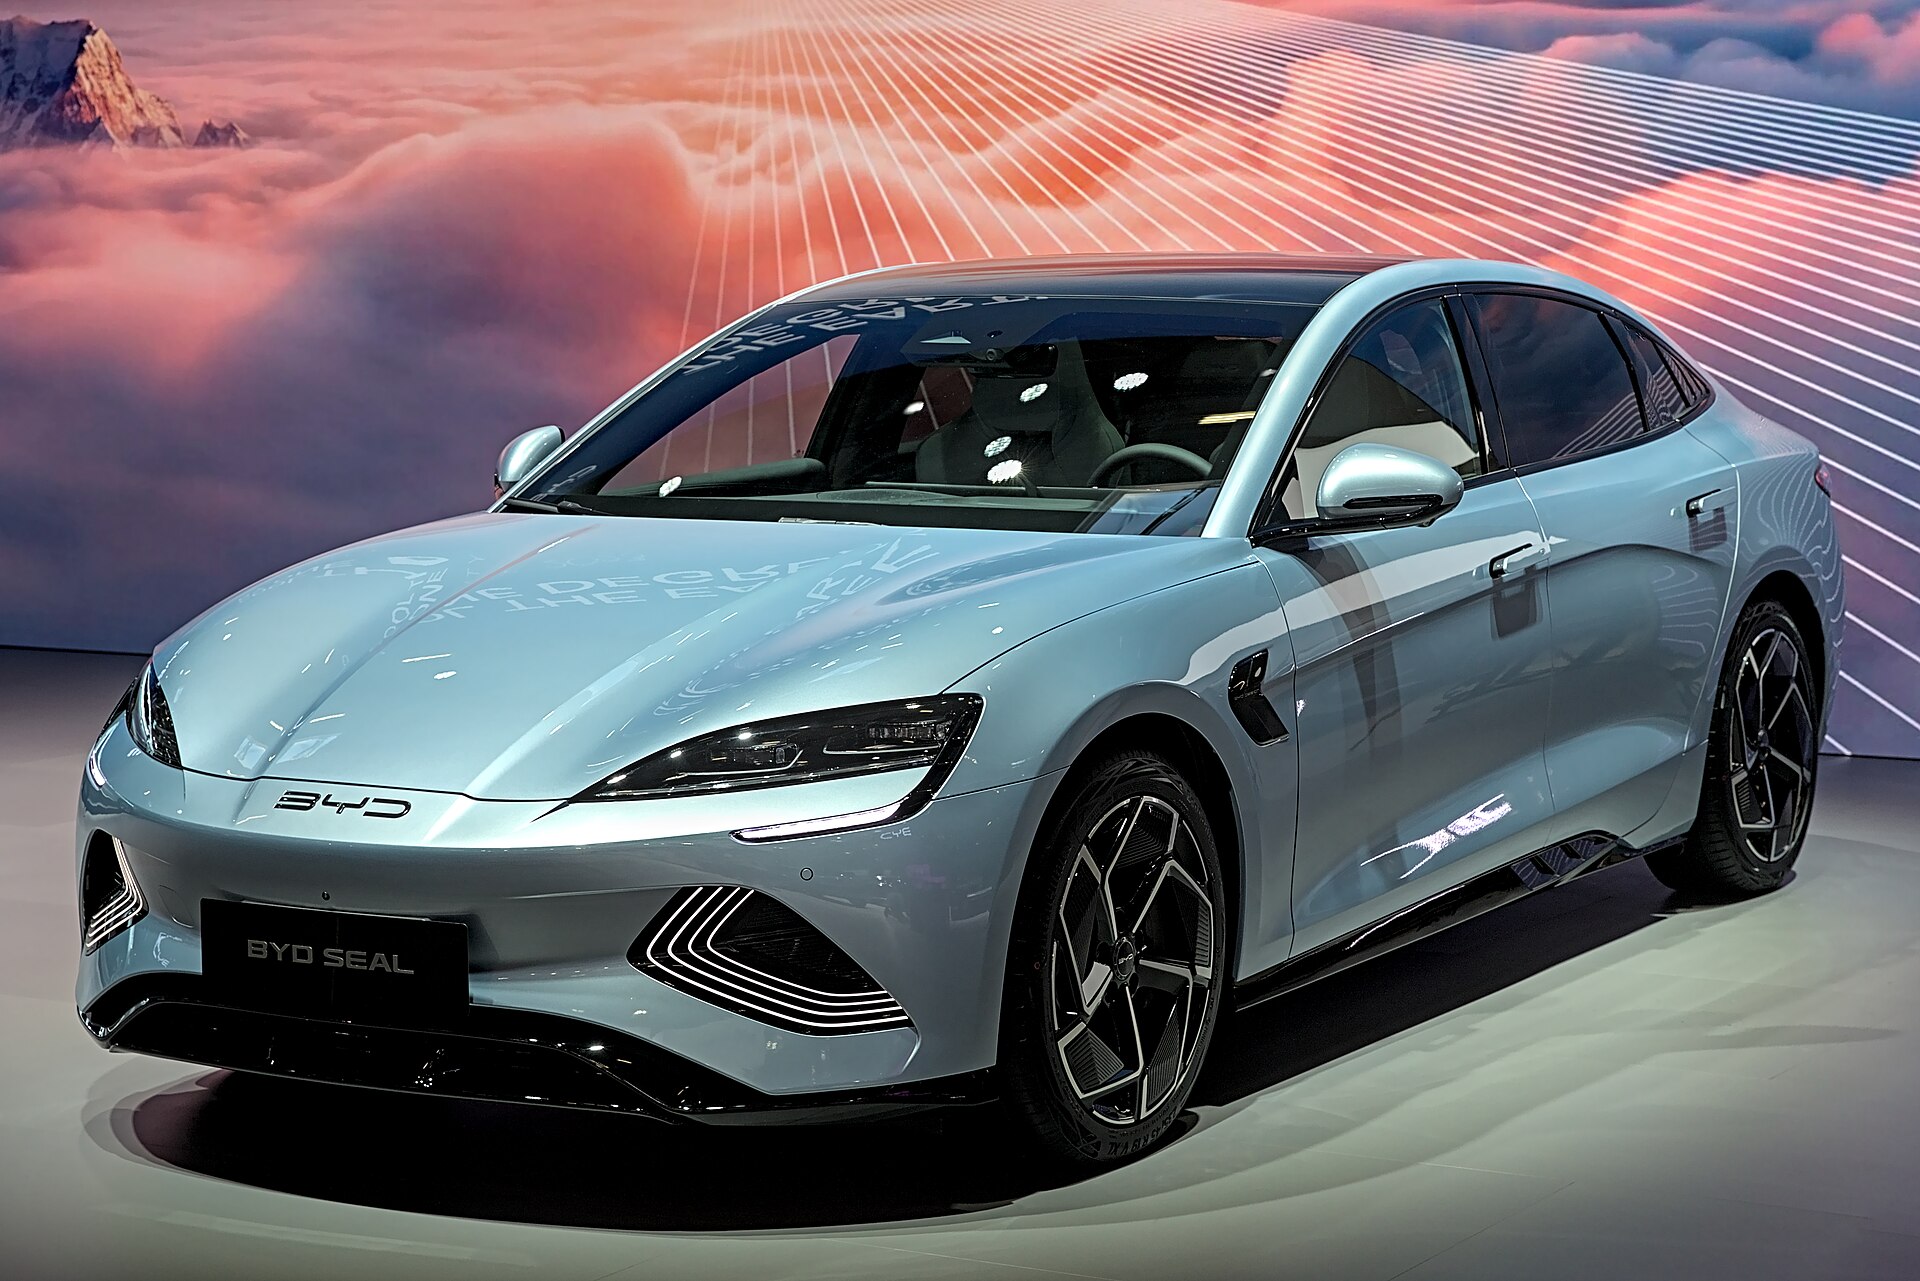
| Question | Tesla Model 3 | BYD Seal |
|---|---|---|
| Powertrain | Electric | Electric |
| Body | Sedan | Sedan |
| Official range | Up to 750 km | 460–570 km |
| Test cycle | WLTP, version dependent | WLTP, version dependent |
| Battery | Not officially disclosed | 61.4 or 82.5 kWh |
| Peak DC charging | Up to 250 kW | Up to 150 kW |
| Published fast charge | About 15 minutes for up to 282 km claimed | 10–80% in about 37 minutes claimed |
| Efficiency reference | From 13.2 kWh/100 km | From 16.6 kWh/100 km |
| Seats | 5 | 5 |
Useful starting points based on the models buyers cross-shop.
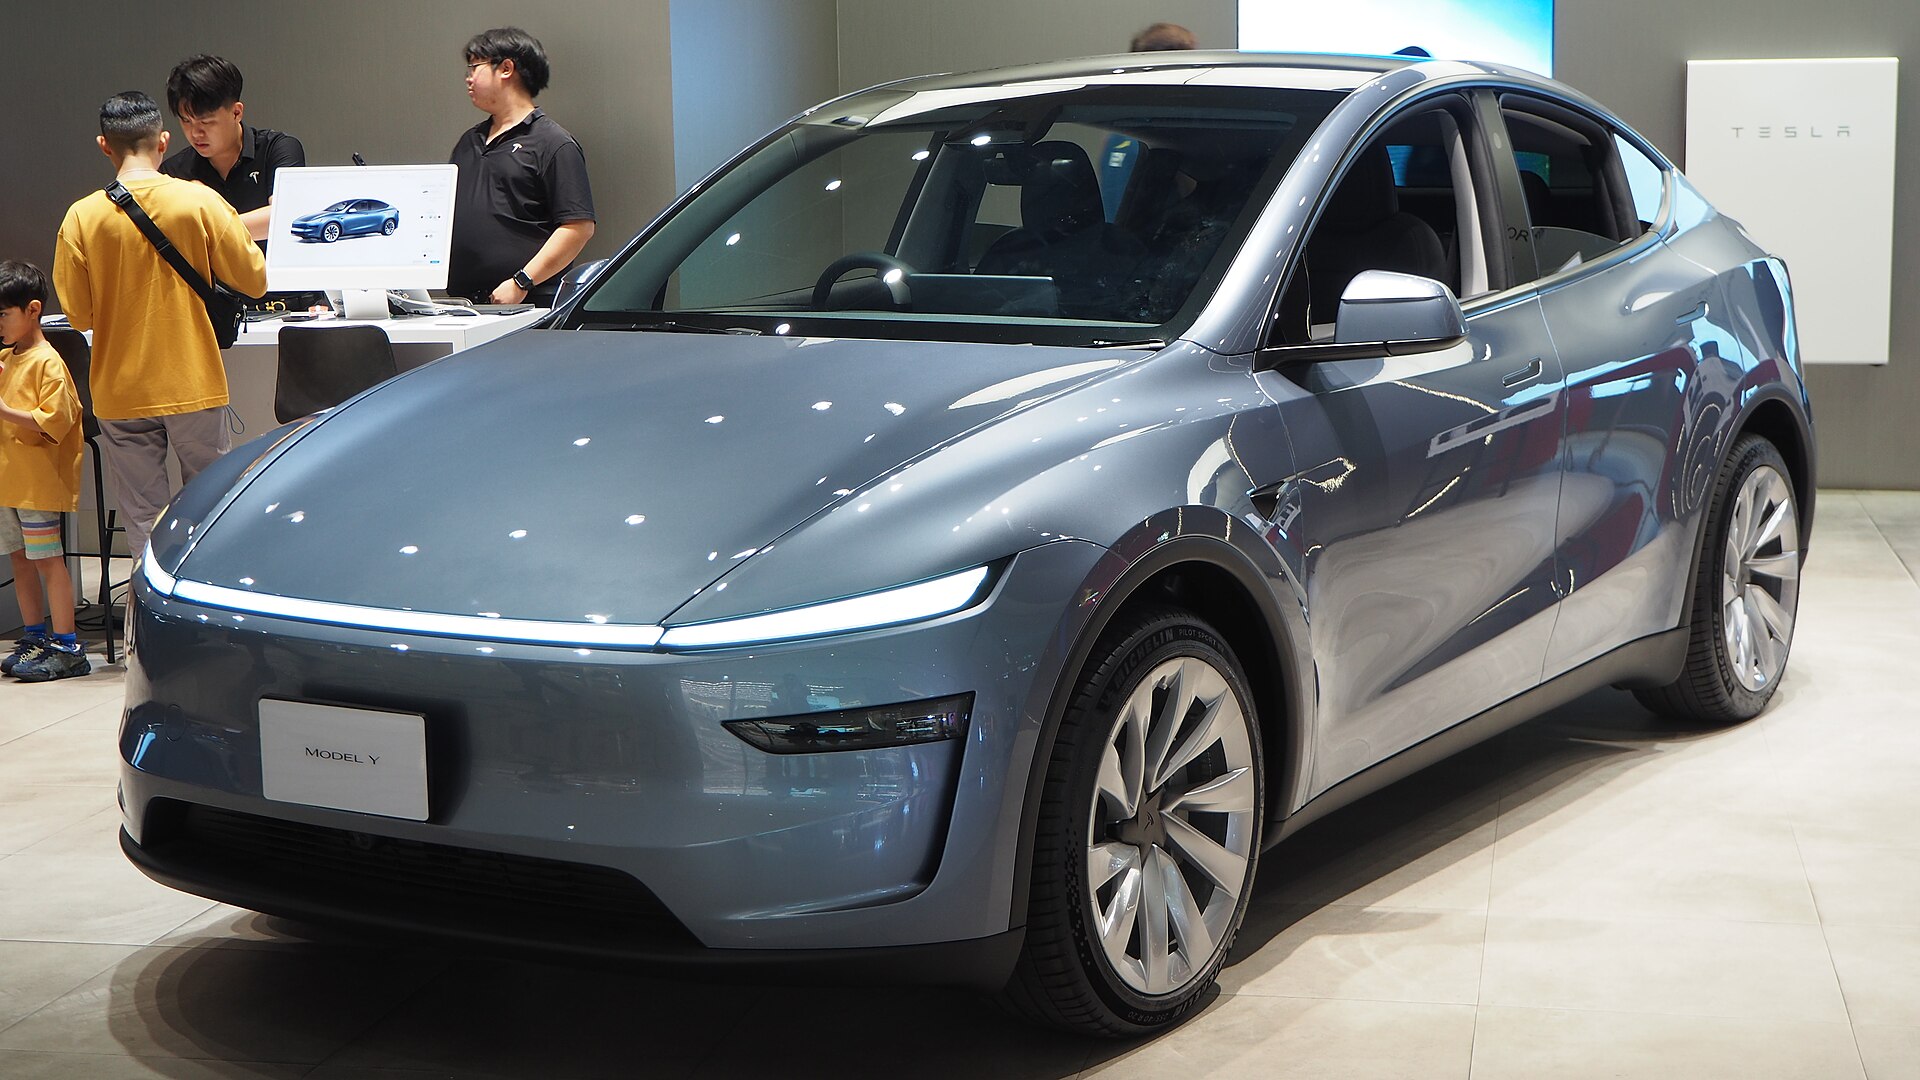
Efficiency and charging access meet equipment and cabin richness.
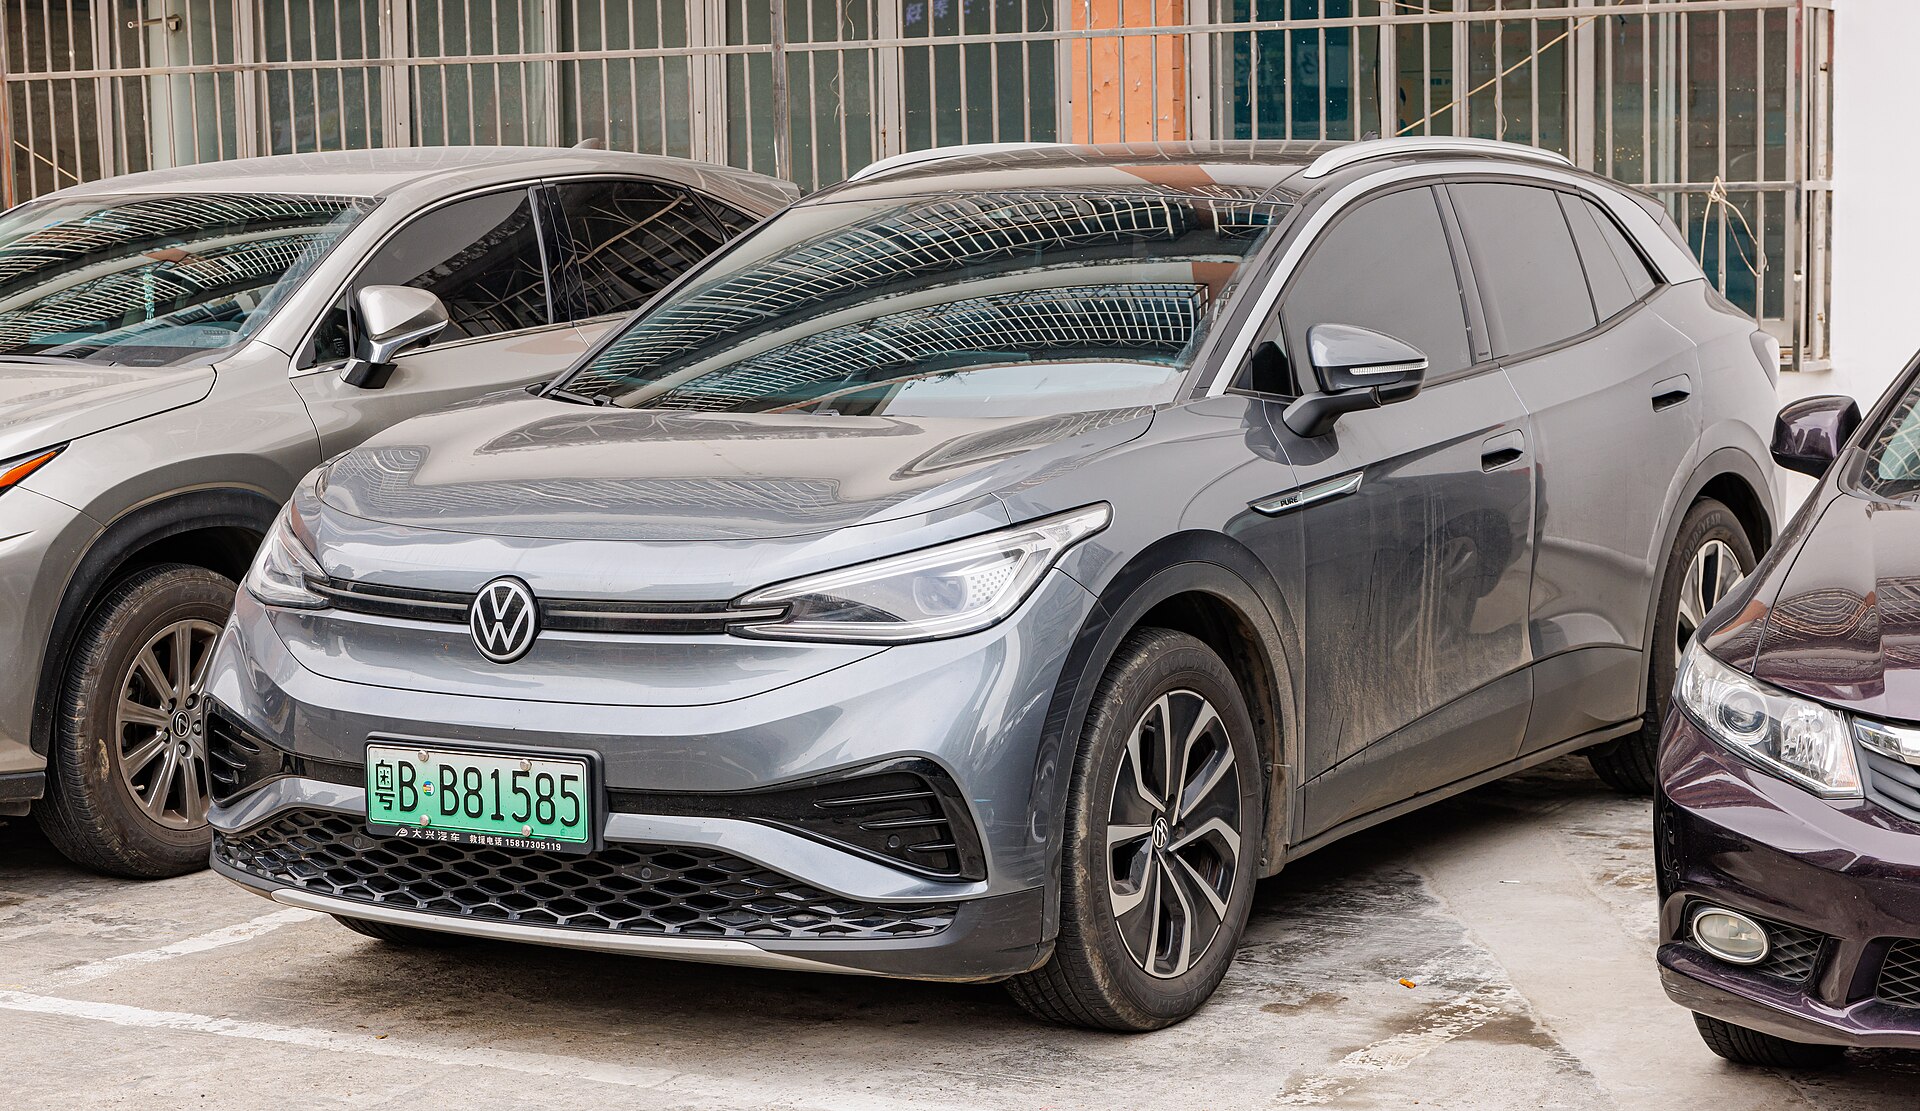
Two family EVs with very different approaches to controls and ownership.
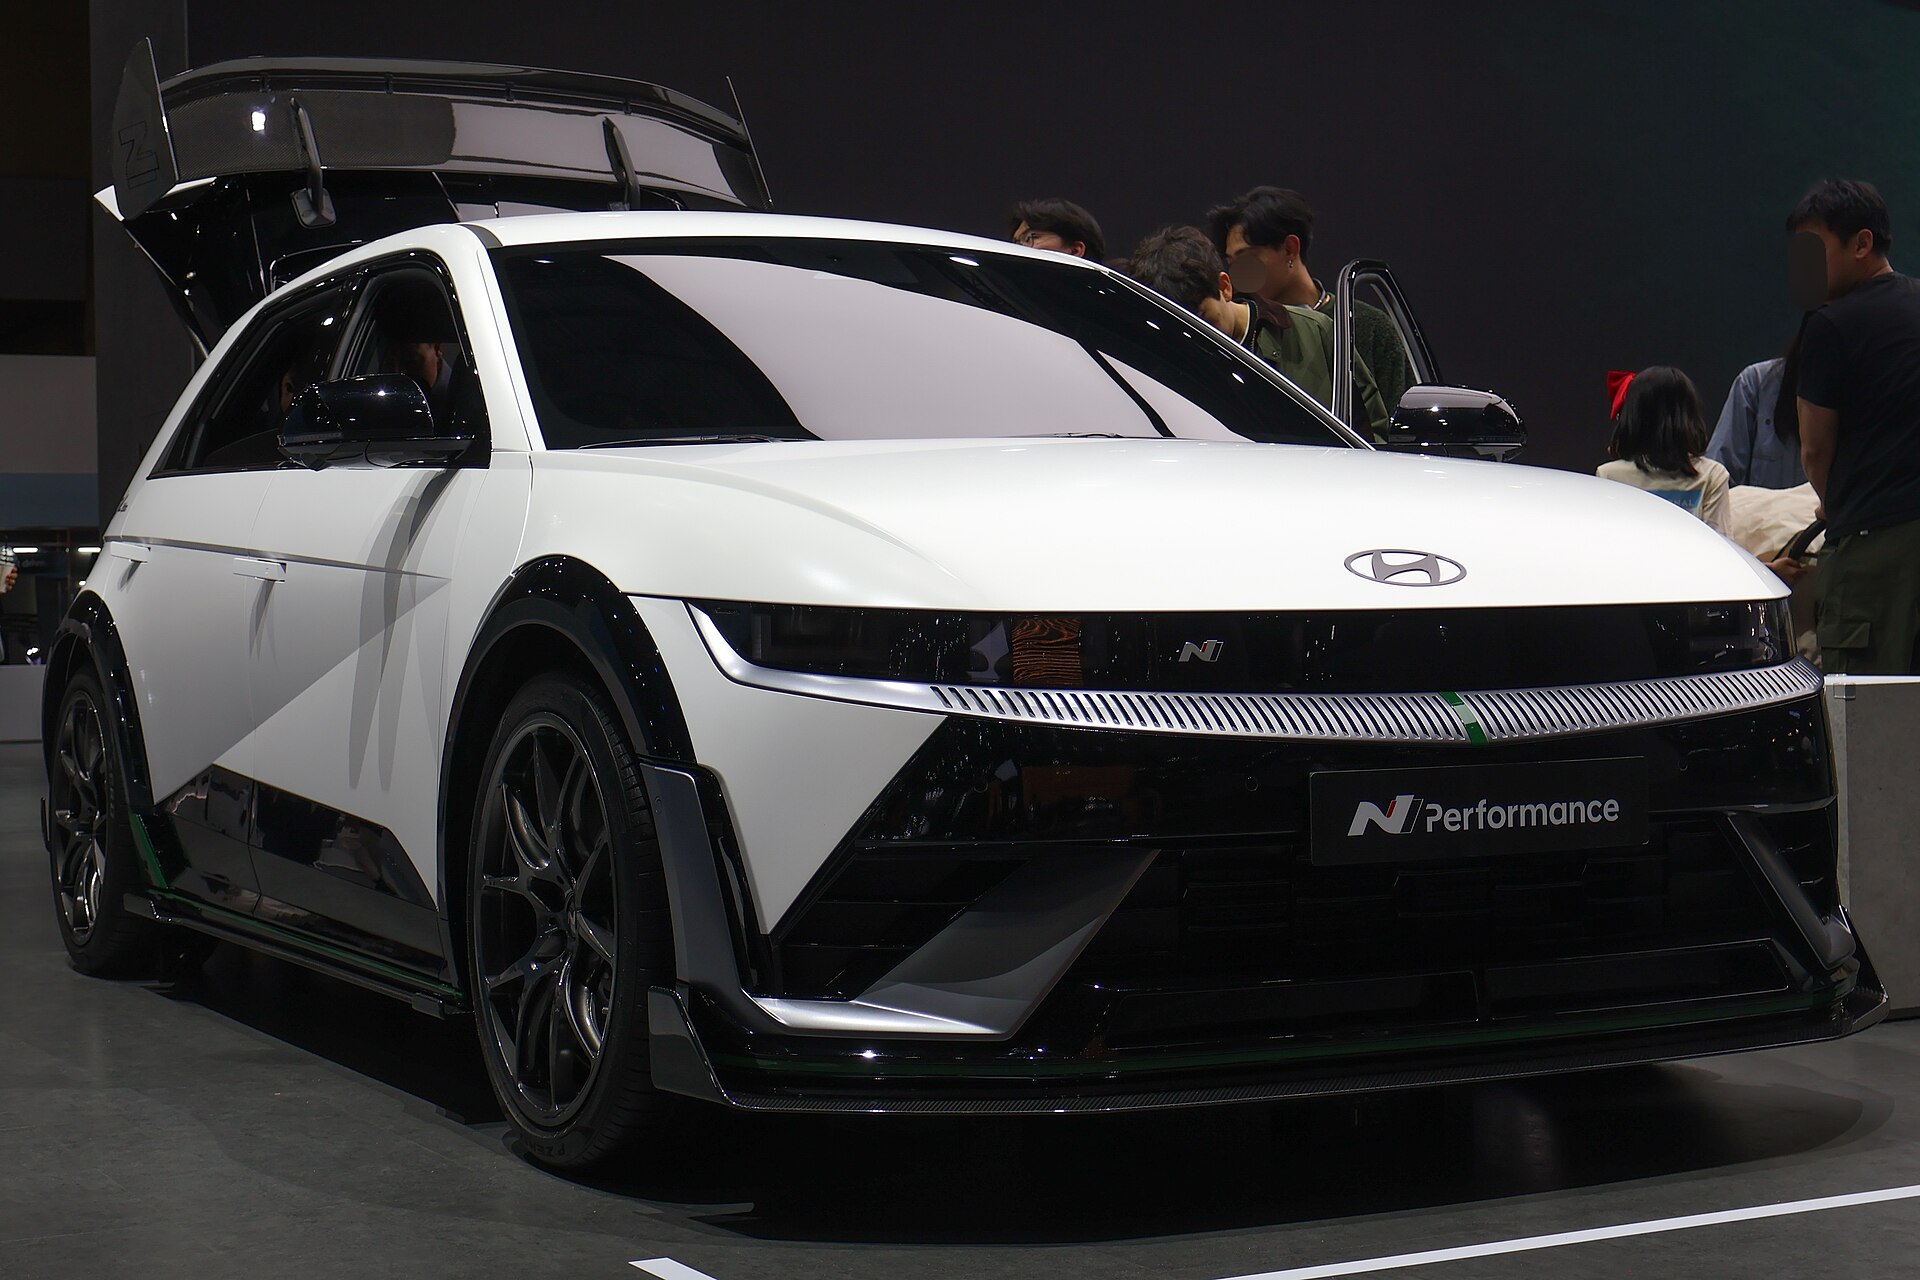
Long-distance efficiency versus exceptionally fast charging and cabin flexibility.
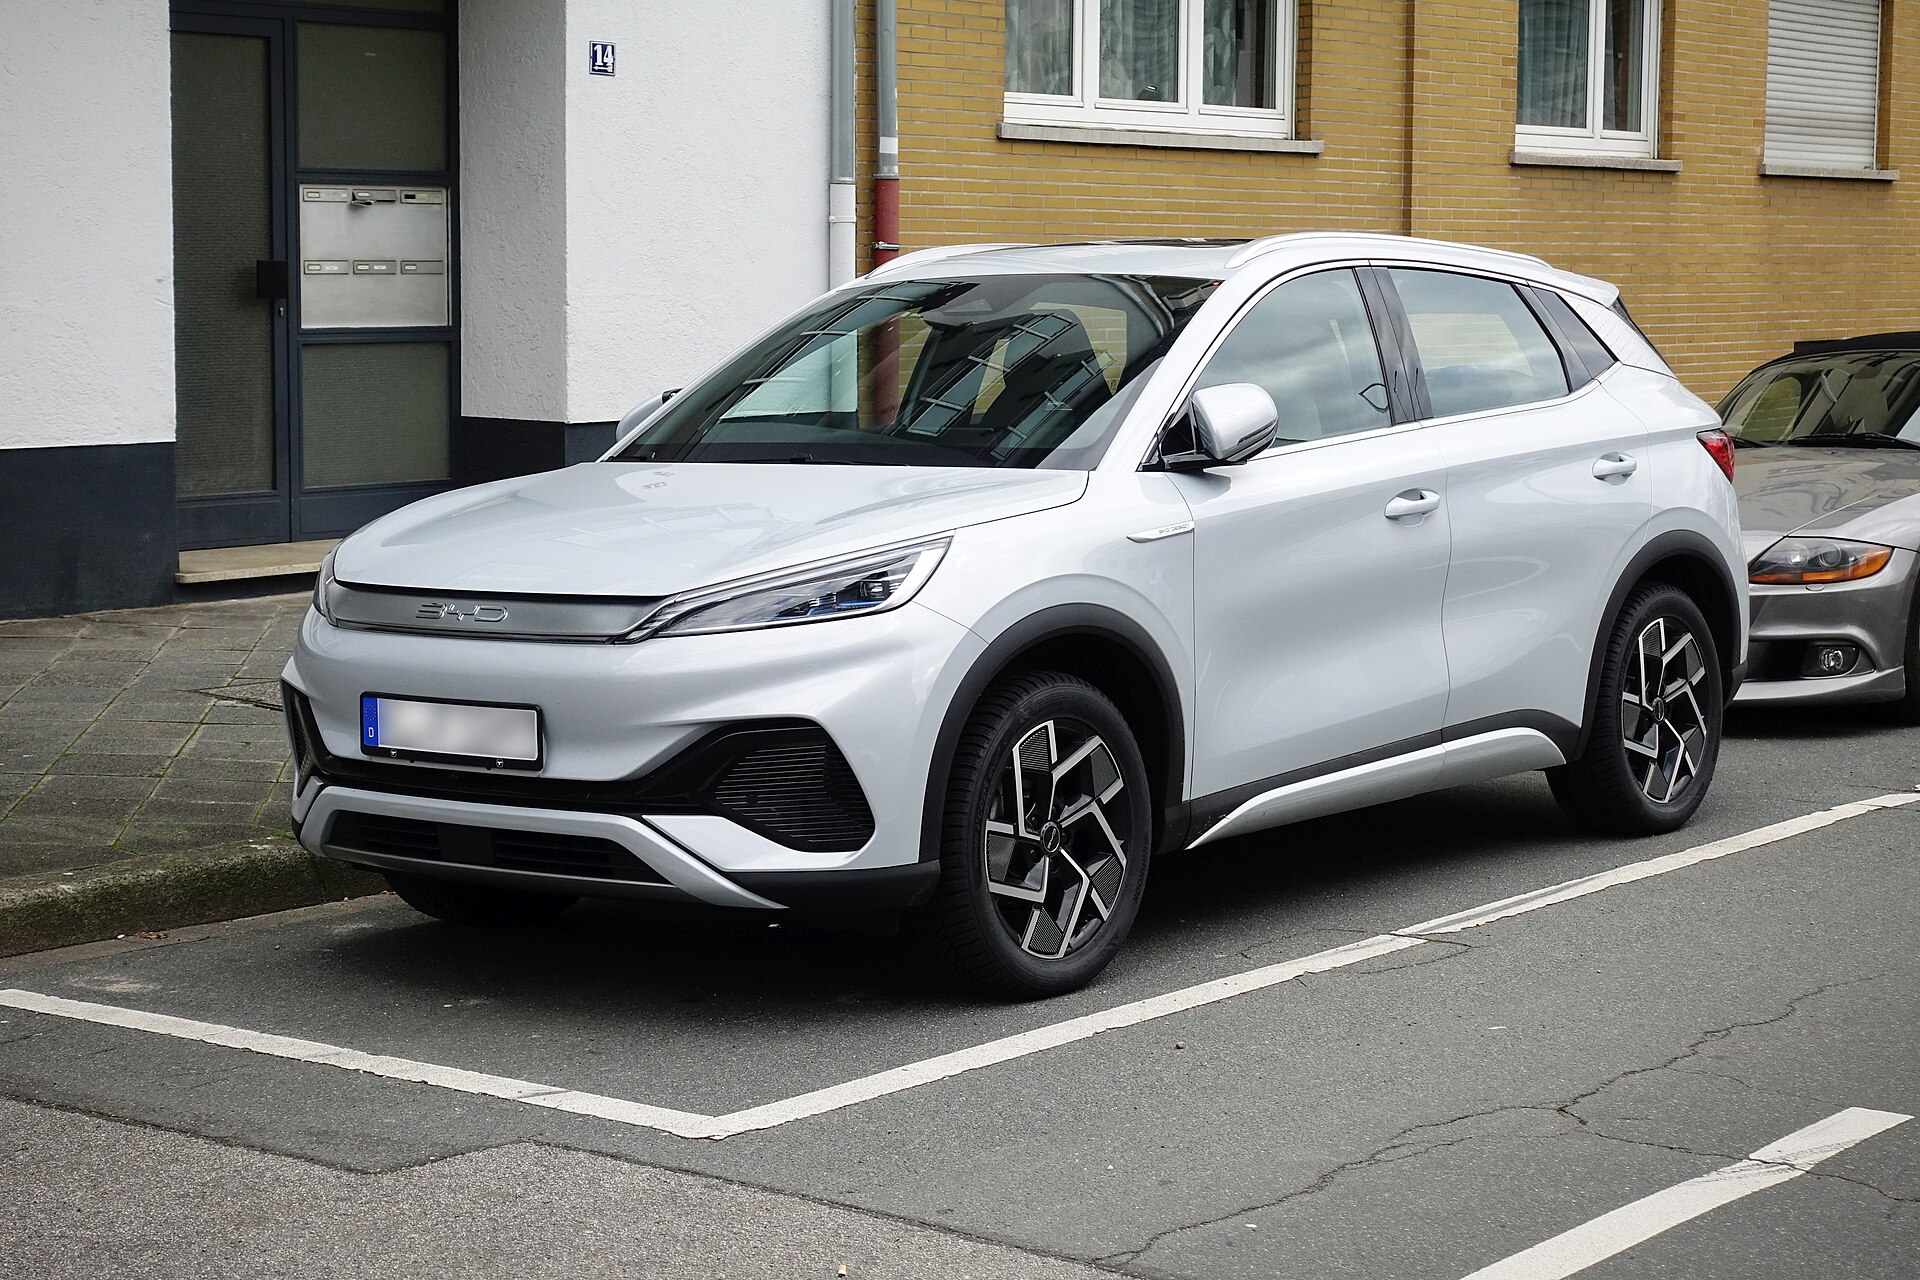
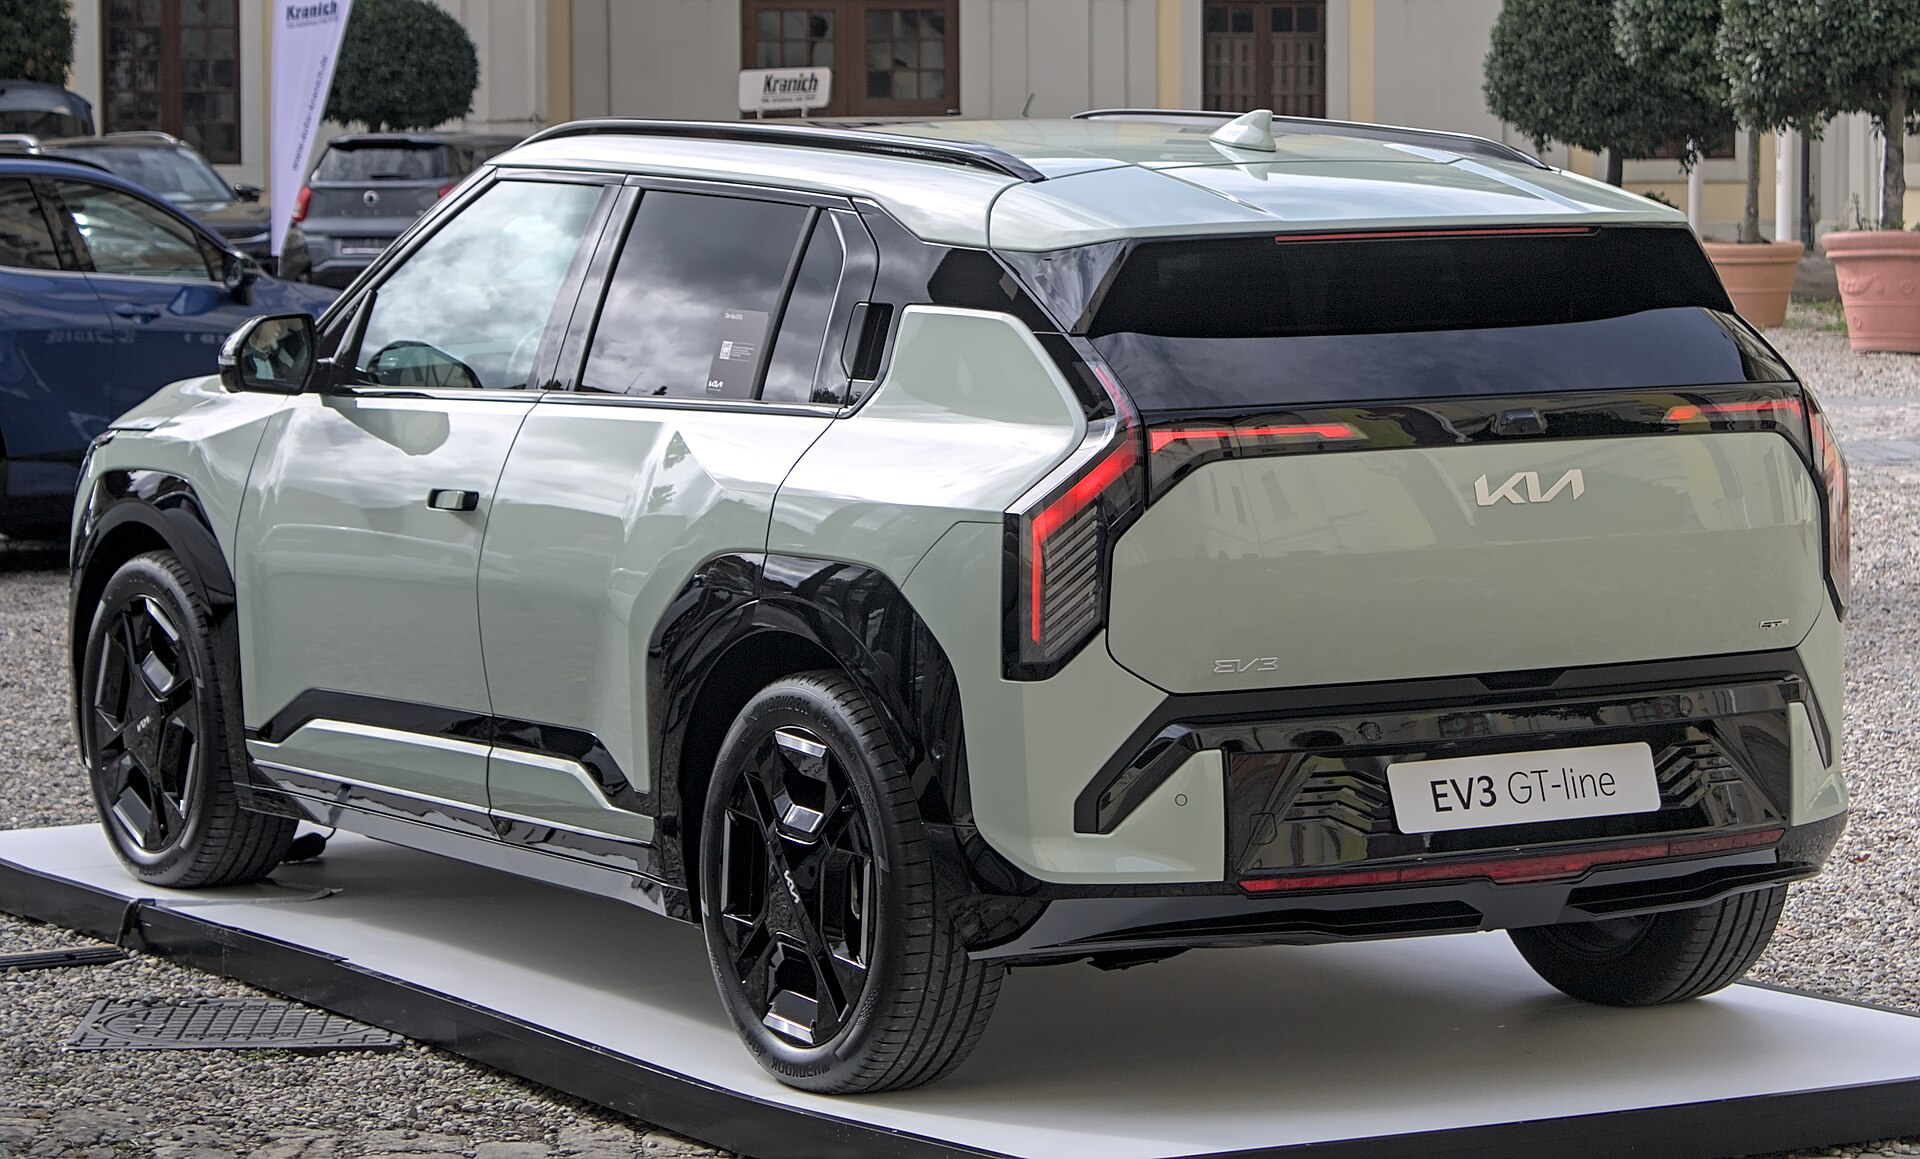
A proven value crossover meets a newer, longer-range rival.
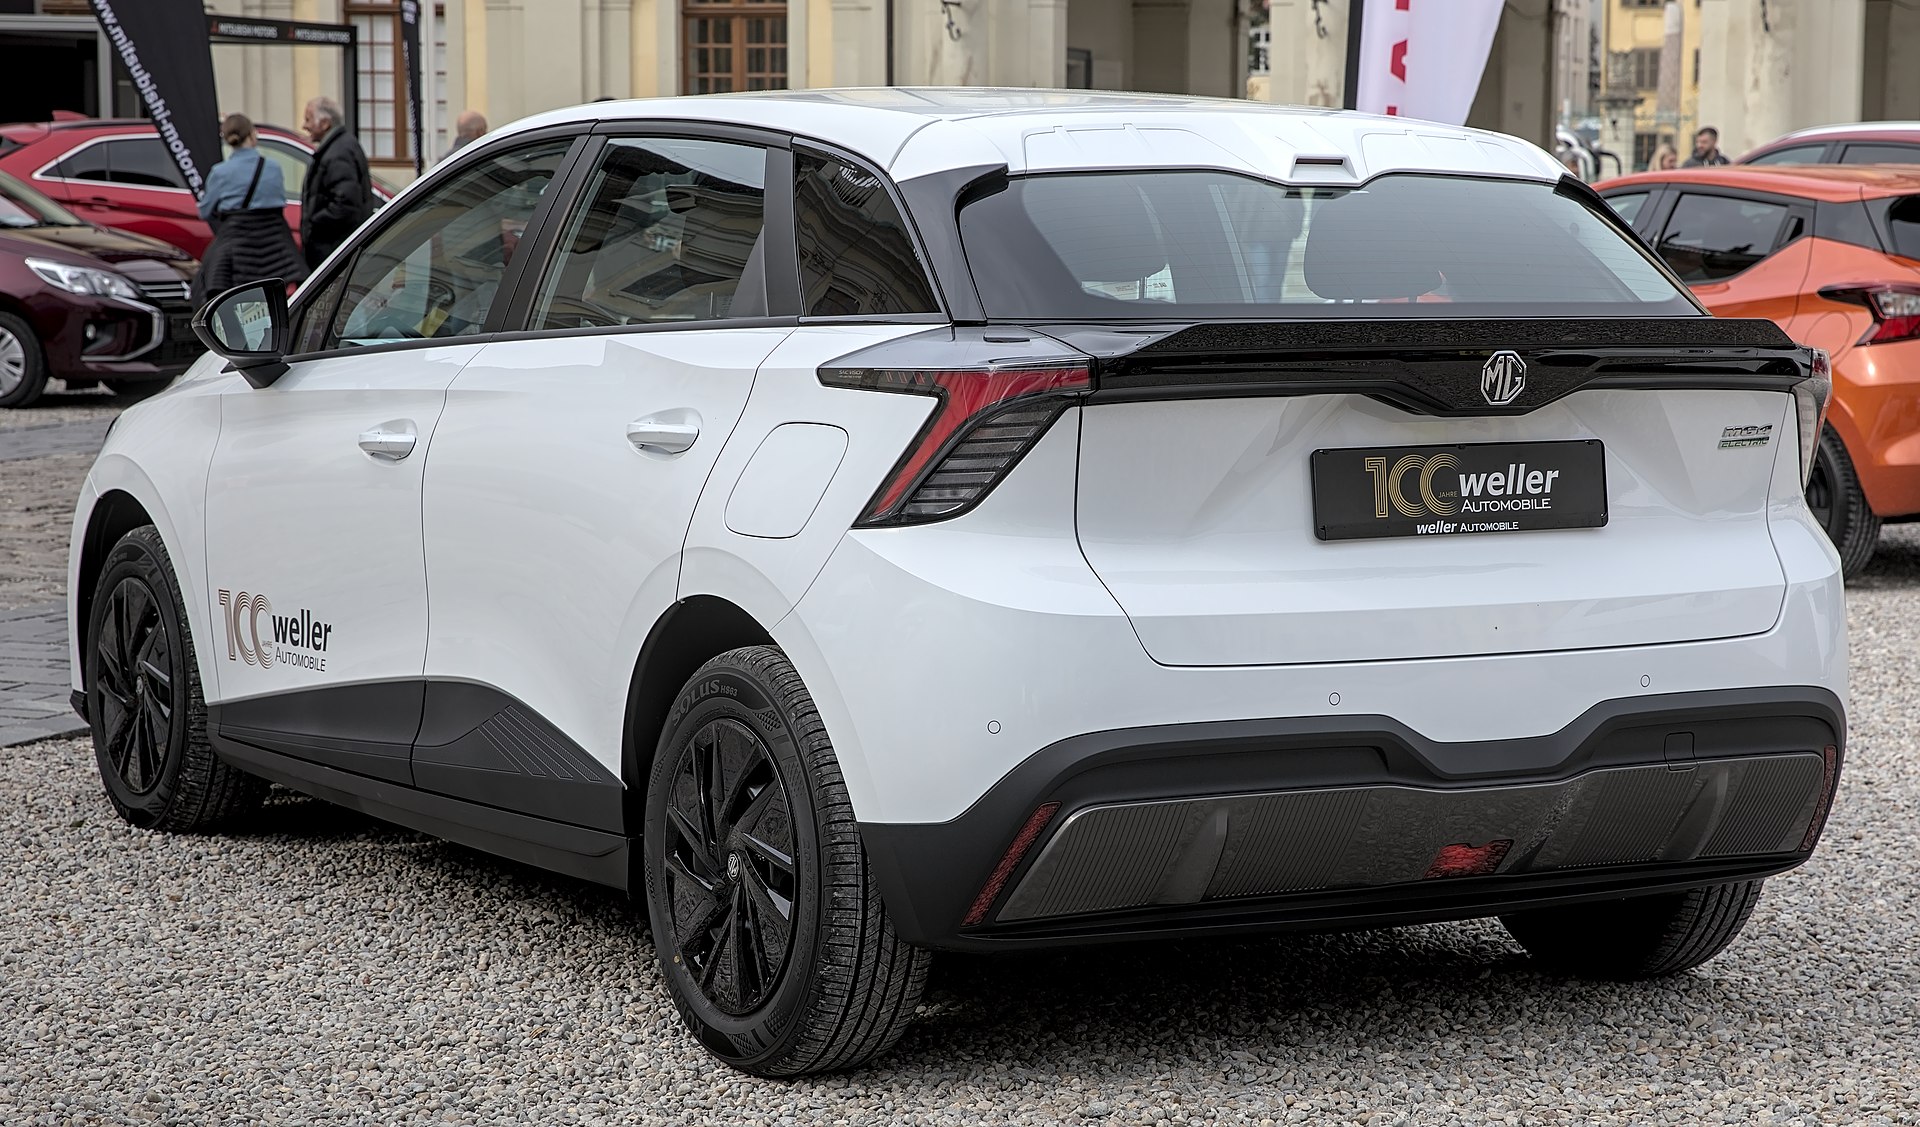
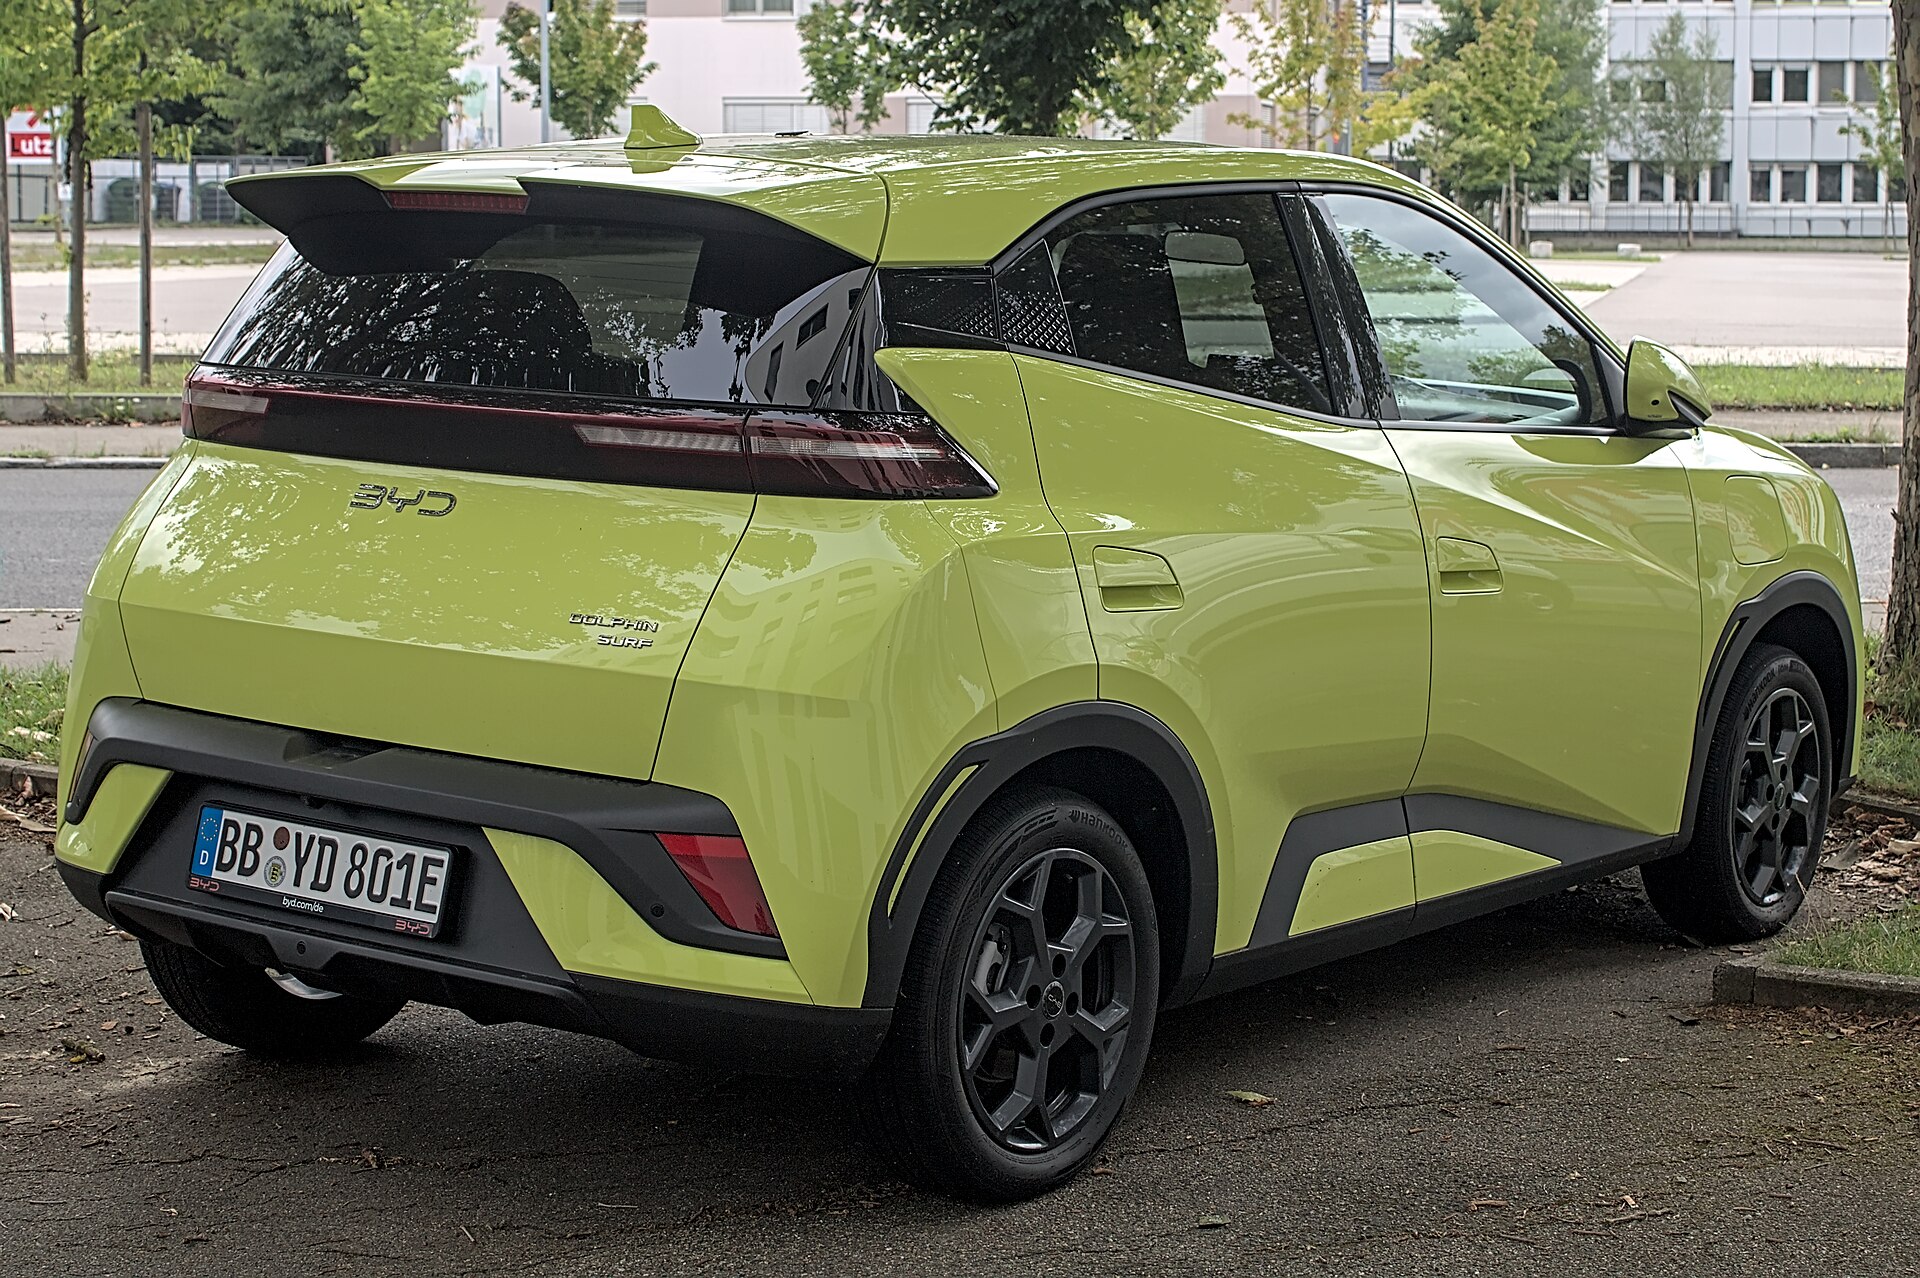
Affordable electric hatchbacks with different priorities and footprints.
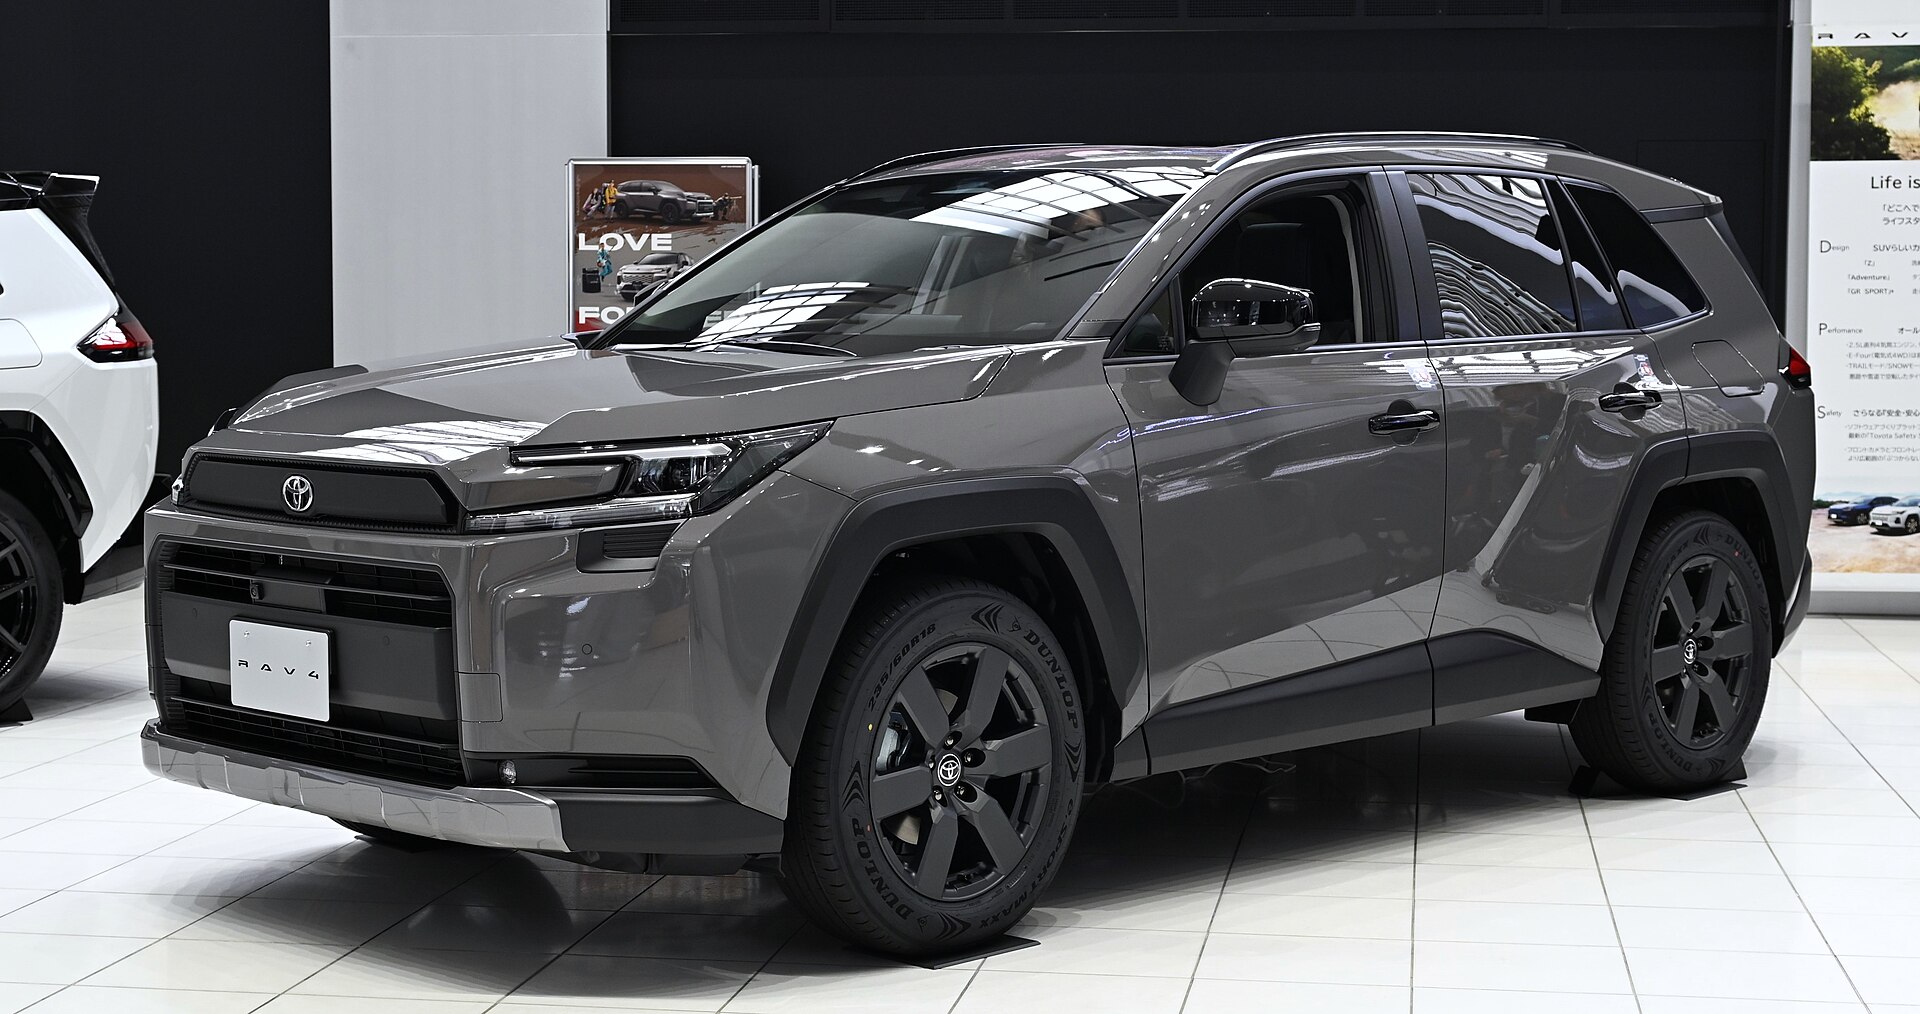
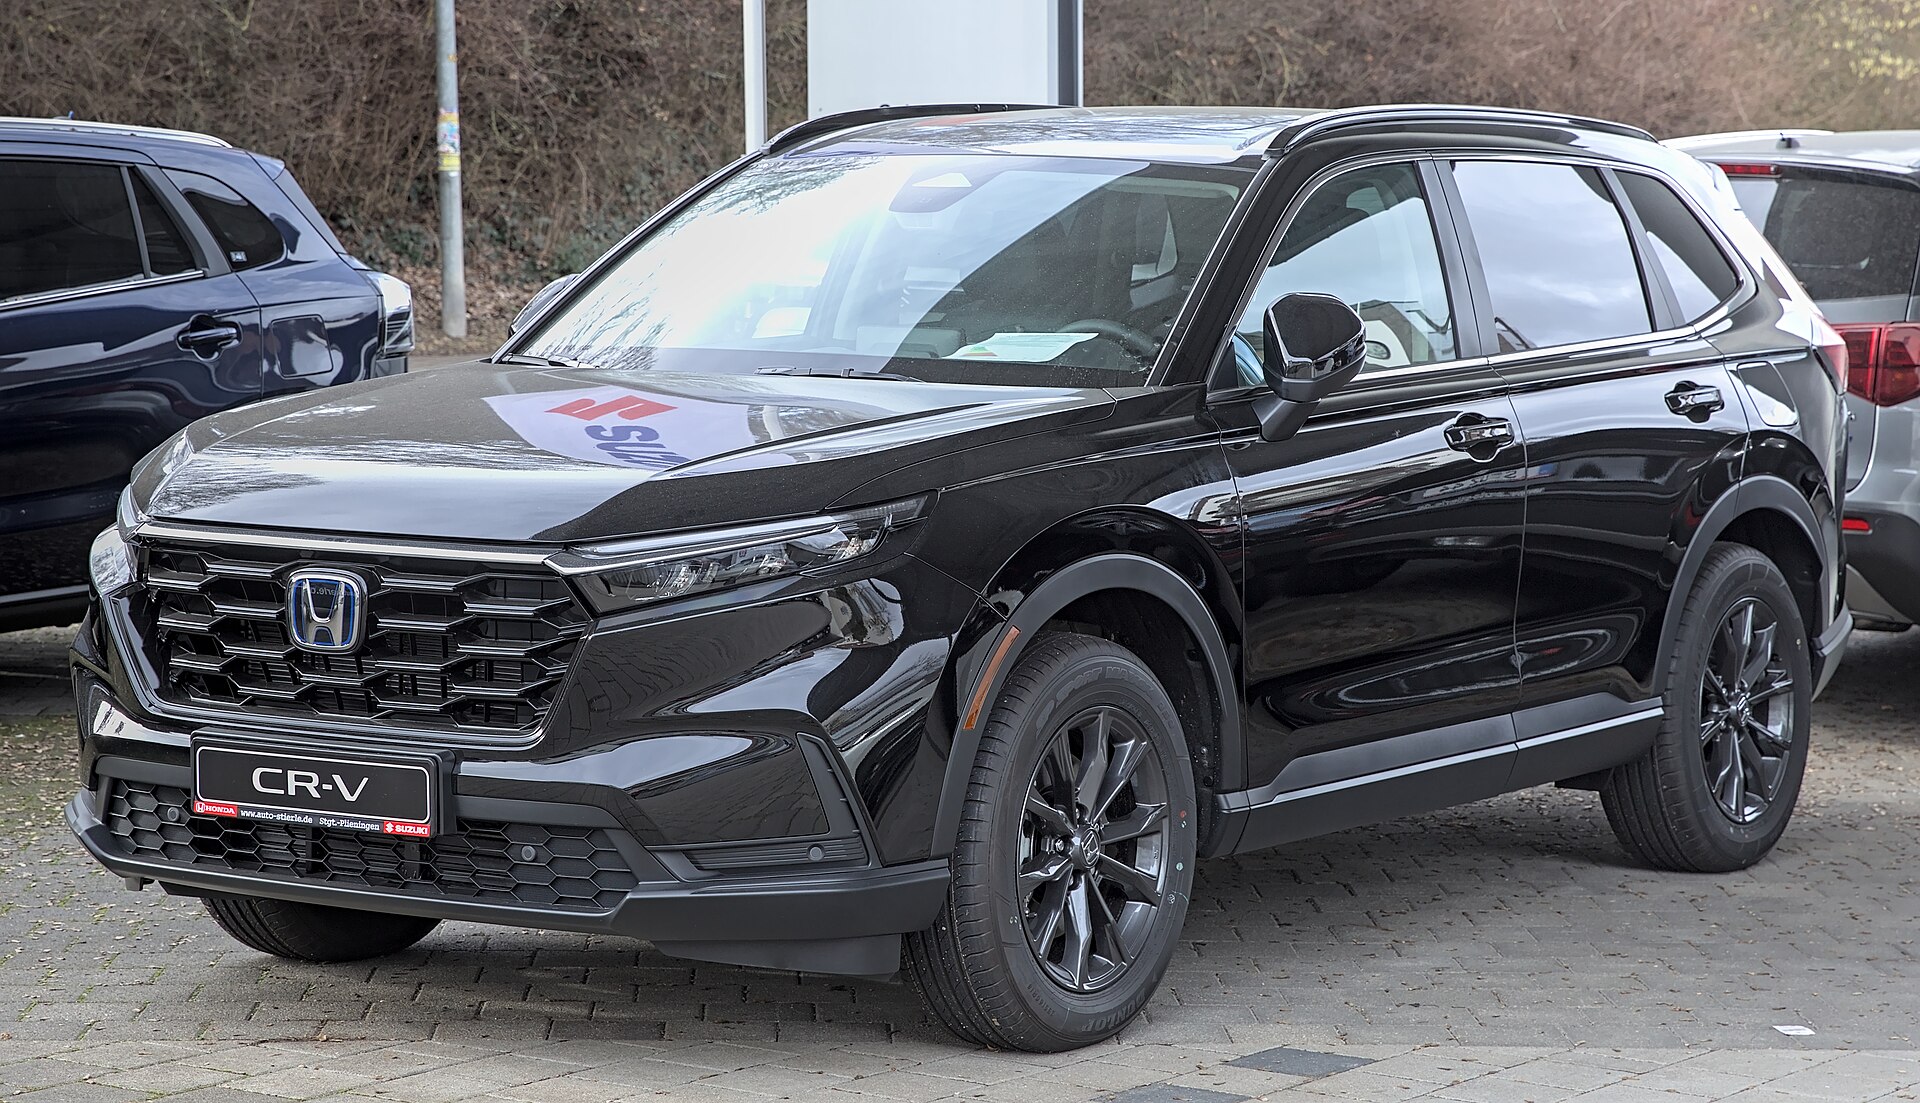
Two mainstream hybrid SUVs compared by the way people actually use them.